Projects
Portfolio
Projects that turn analysis into usable evidence.
These projects highlight the parts of data work I care about most: clear framing, defensible methods, careful validation, and outputs that communicate something useful.
Featured Project
Data Visualization Portfolio
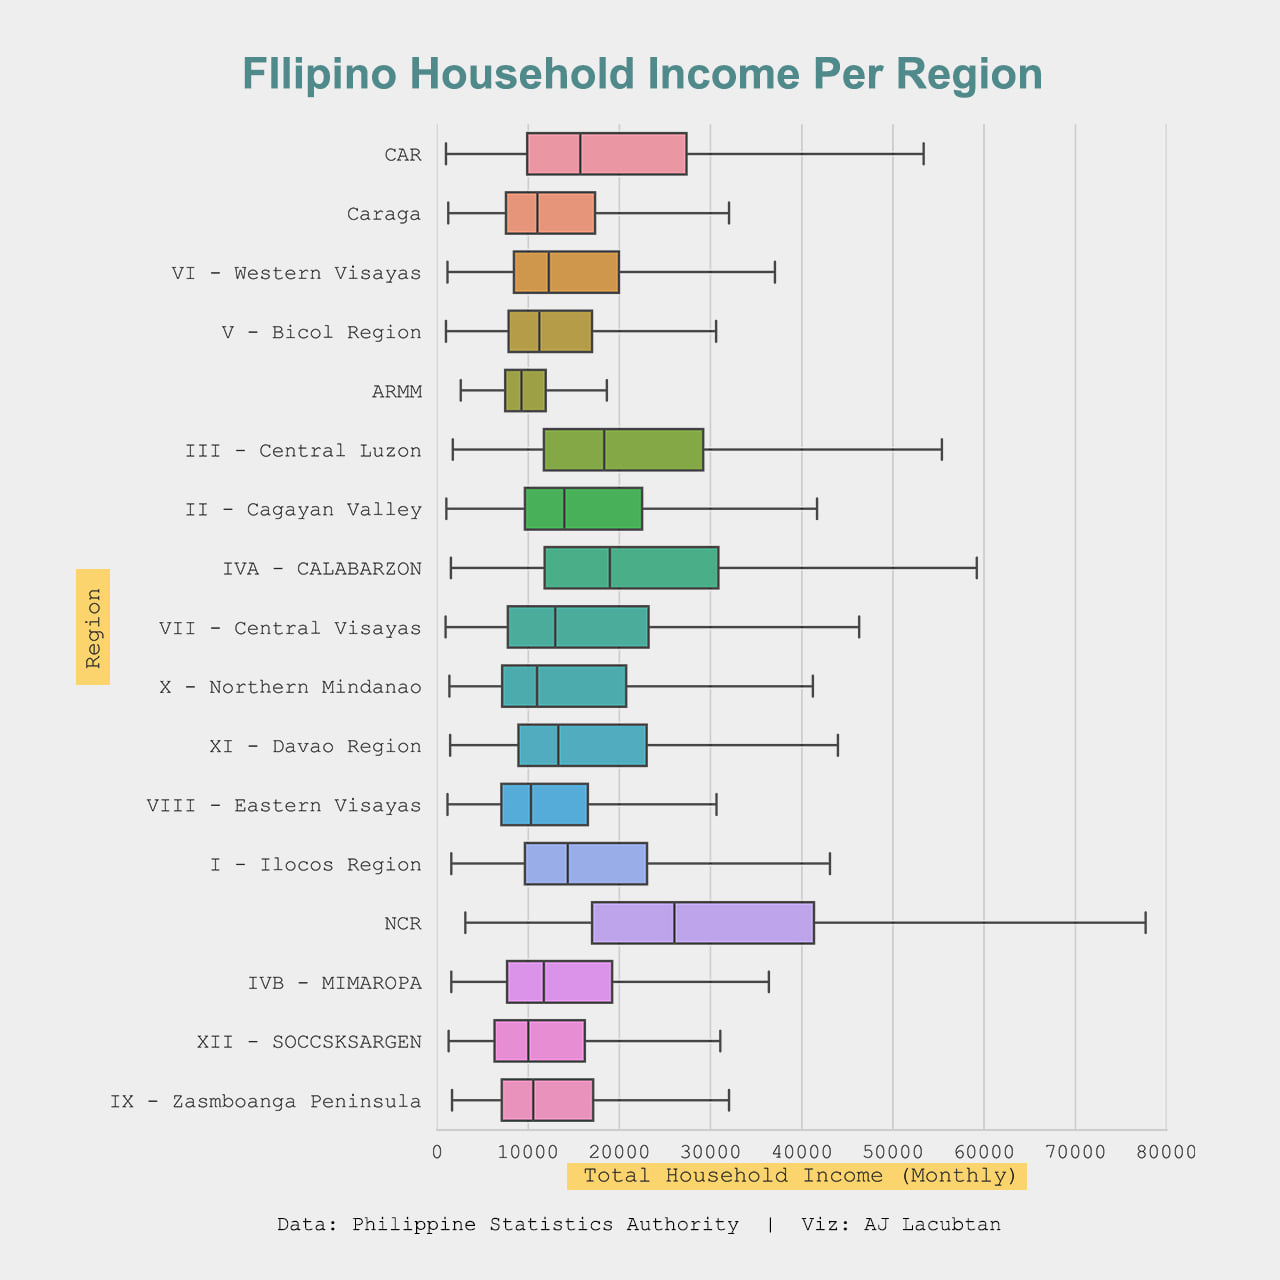
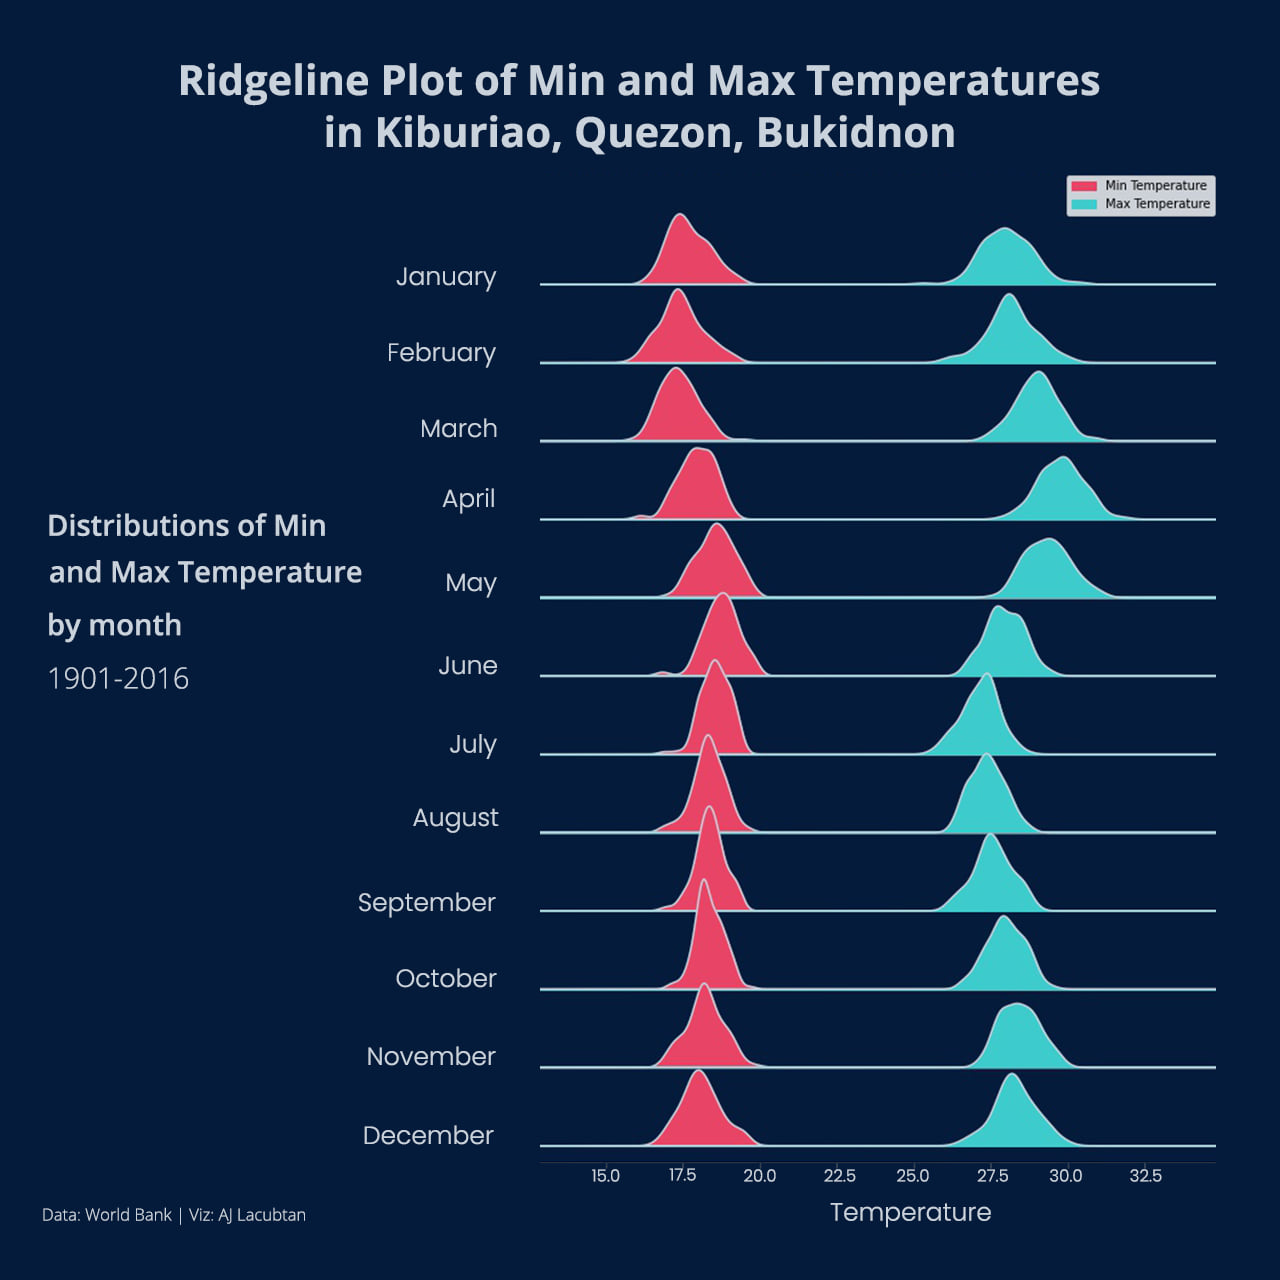
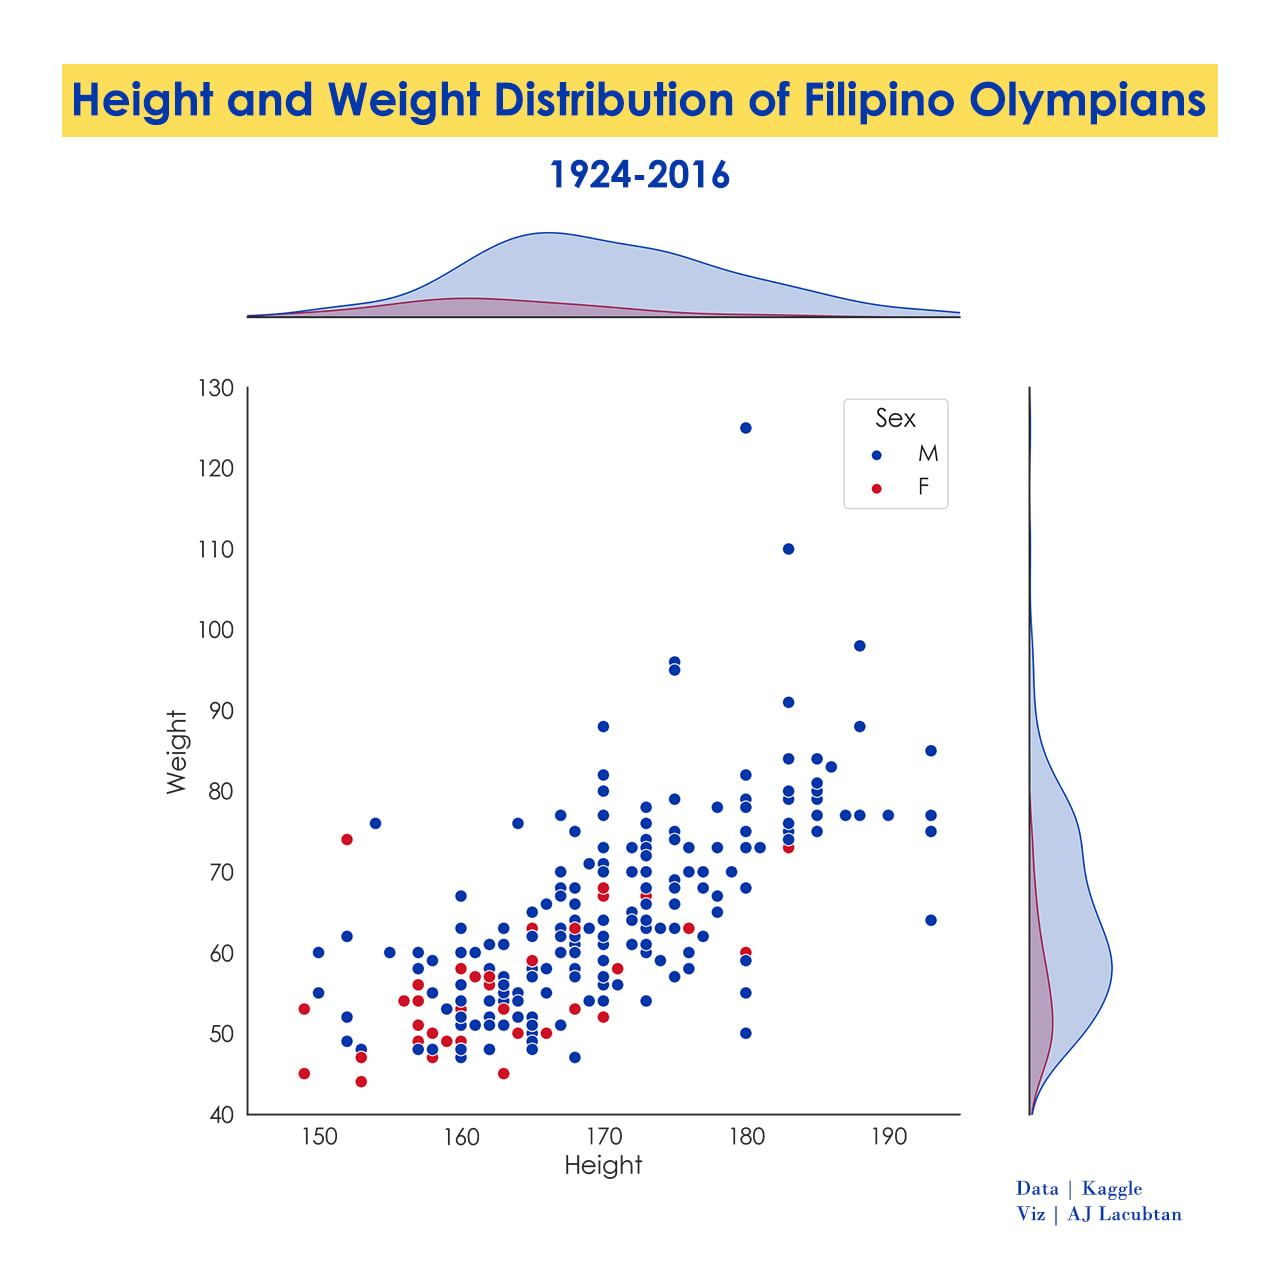
A curated set of visual stories using Python, R, Matplotlib, Seaborn, and ggplot2. The collection covers income inequality, climate patterns, vaccine rollout, voter demographics, statistical density, and exploratory visual design.
Python R matplotlib seaborn ggplot2

Project Index
Full project writeups and portfolio entries.
Data Visualization Portfolio
data visualization
storytelling
matplotlib
seaborn
ggplot2
No matching items